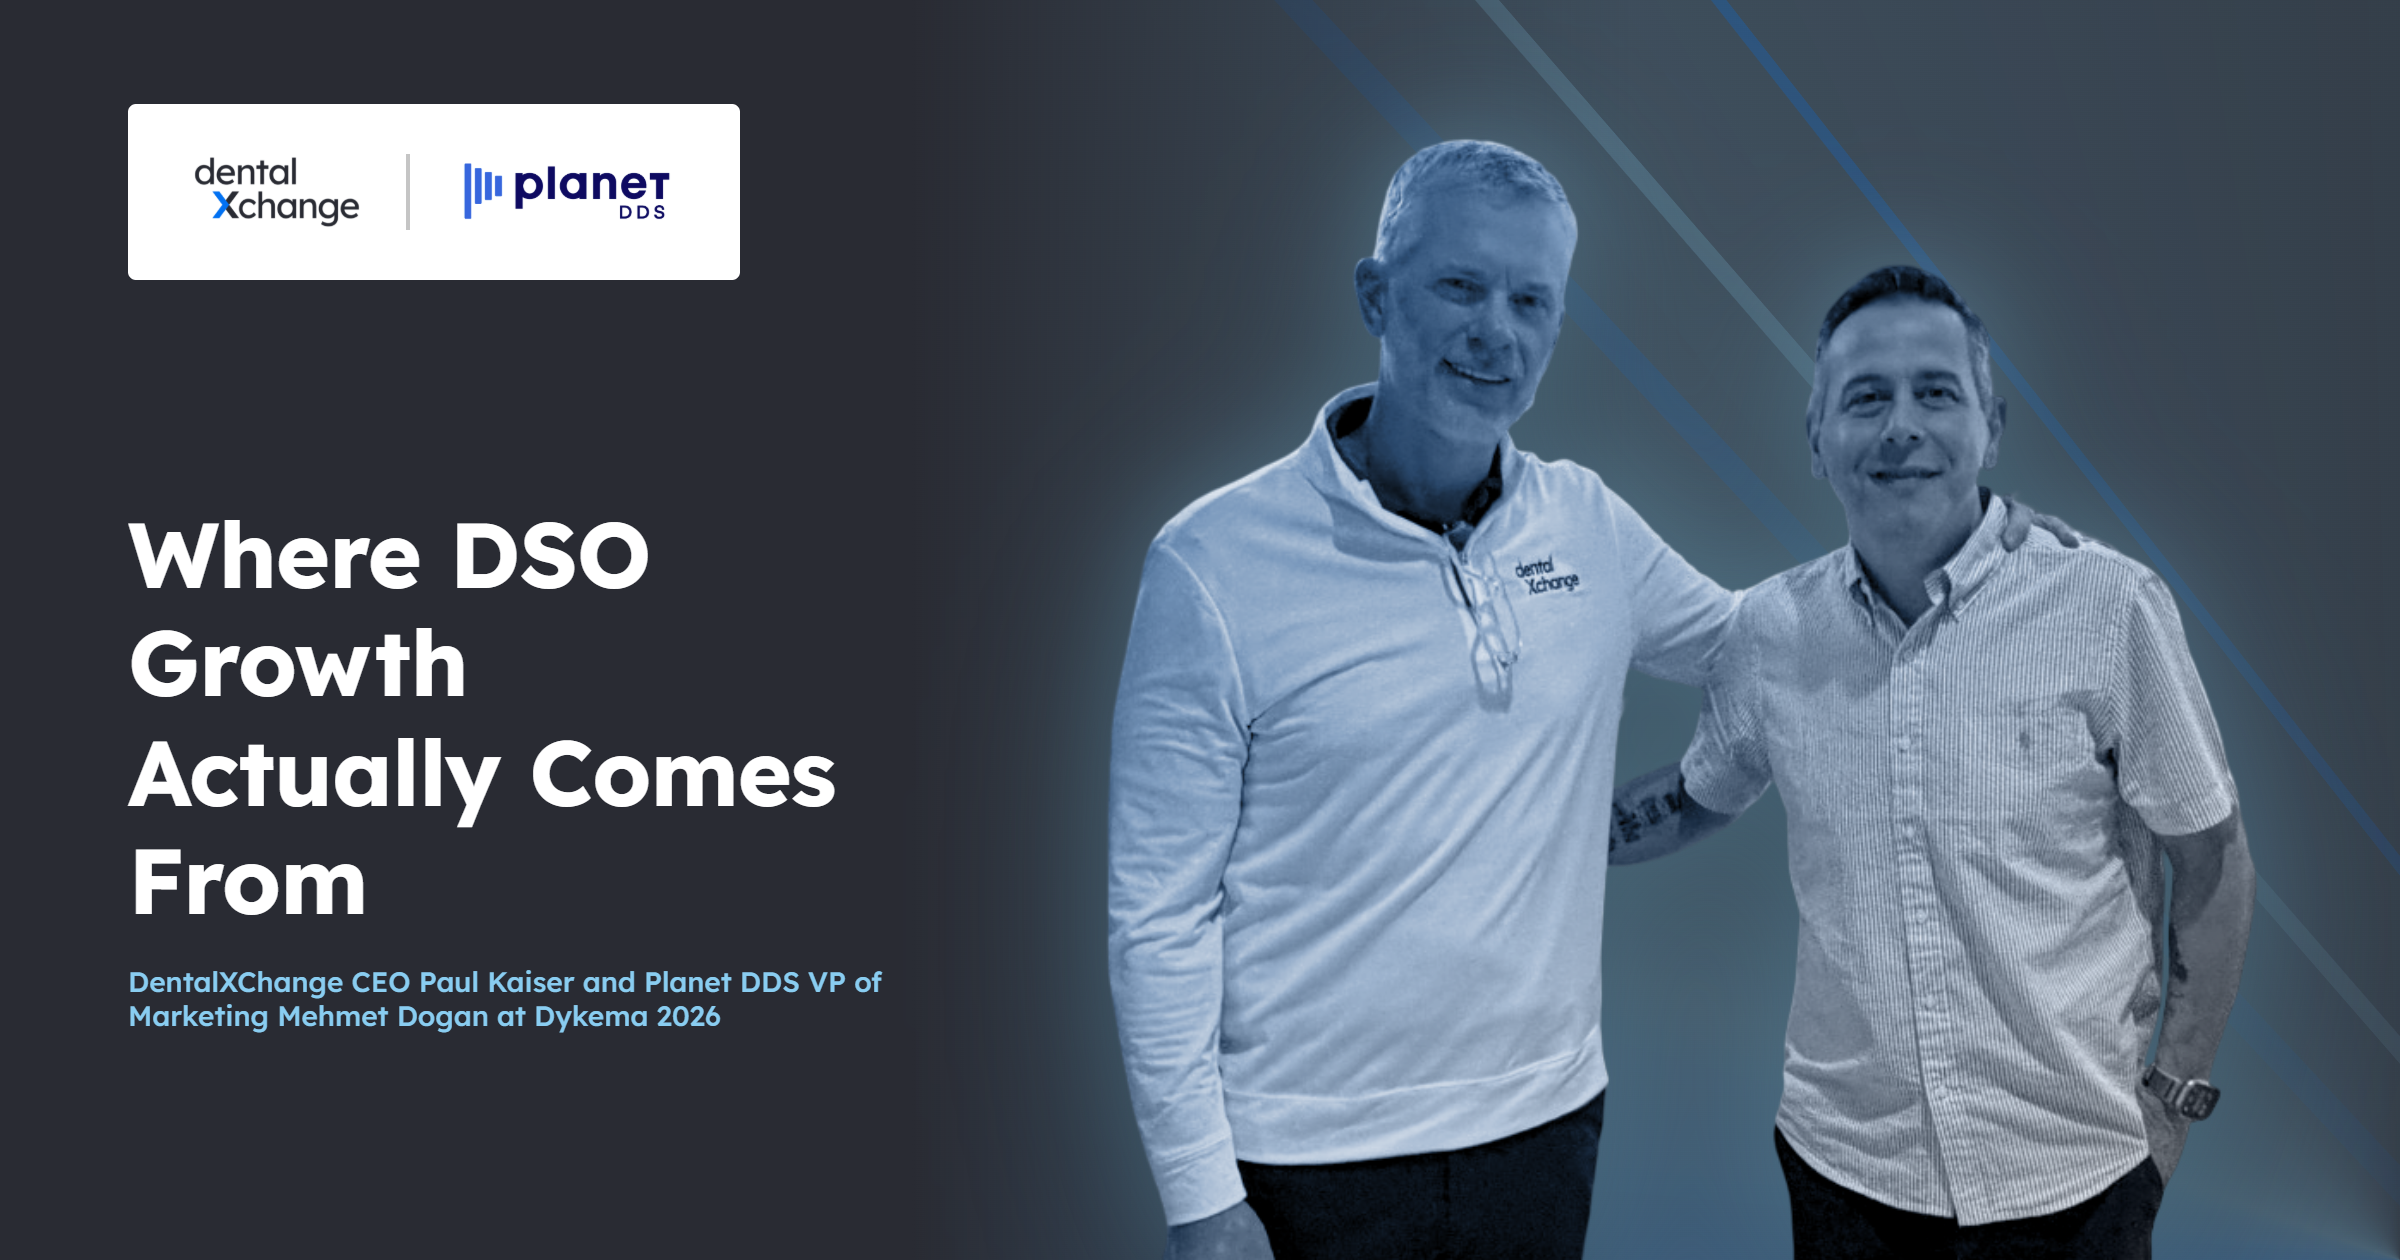
Where DSO Growth Actually Comes From


The following is an interview between DentalXChange CEO Paul Kaiser and Planet DDS VP of Marketing Mehmet Dogan – walking through Planet DDS’s 2026 Dental Industry Outlook: Deep Dive released at the Dykema DSO Conference in July…
1. To start — tell us about the 2026 Dental Industry Outlook Deep Dive. What makes this release different from the reports Planet DDS has put out before?
We've published an industry outlook for three years running now, but the first two were essentially benchmarks such as case acceptance rate. Useful data, but static. This year we did something different. Instead of just reporting stand alone metrics, we went looking for what actually correlates with growth.
The other thing that makes it different is the foundation. This isn't a survey, and it isn't a sample. It's the largest DSO data set in the world and real production data from more than 8,500 practices that have been on our platform for at least two years, analyzed on a same-store basis comparing 2025 to 2024. Every appointment, every claim, every treatment plan is logged in real time in the software. When we say 63% of practices grew last year and the weighted average was 4%, that's not an estimate. That's what happened.
And what happened is more interesting than any single benchmark. The industry is bifurcating. A third of practices grew more than 10% last year, nearly 14% shrank by more than 10%, and the middle is getting squeezed. The Deep Dive is really an attempt to explain why.
"This is the largest DSO data set in the world, real production data from more than 8,500 practices. When we say 63% of practices grew last year, that's not an estimate. That's what happened." Mehmet Dogan, VP of Marketing, Planet DDS
2. This report is built on data from thousands of practices across your platform. What was the finding that surprised your own team the most?
Case acceptance. The whole industry treats it as the holy grail of growth… raise your acceptance rate and everything else takes care of itself. When we actually charted case acceptance against revenue growth across the network, the correlation was essentially zero. It came in at −0.09. We split practices into four quadrants: high growth/high acceptance, high growth/low acceptance, and so on, and the distribution across all four was almost perfectly even.
What actually predicts growth is the gap between case acceptance and case completion. Practices that accept everything and complete everything don't grow. They're likely running slower schedules with limited upside. Practices with a massive gap — let's say 77% acceptance but only 20% completion — are also shrinking, because they've got a follow-through problem dressed up as a pipeline. The sweet spot is a moderate gap, somewhere in the 10-to-30 point range. That signals healthy demand plus the operational discipline to close the loop.
So the surprise wasn't just that case acceptance doesn't drive growth. It's that completion, the thing most operators aren't measuring, is the real constraint.
3. One of the headline findings is that new patient acquisition is the single strongest predictor of growth — more than case acceptance or completion. Why do you think that gets overlooked?
There's a deeply held belief in dentistry that you already have all the dentistry you need inside your own four walls. The logic is that if you just execute flawlessly on hygiene reappointments, patient reactivation, and unscheduled treatment, you'll grow without spending on marketing. And maybe that's true in theory, but it's really, really hard to do in practice, and the data says the practices betting on it are mostly treading water.
When we tested every operational variable against growth, new patient volume was the strongest predictor by a wide margin. There's a clear threshold at about 35 new patients a month. Below it, growth averages 4.5% whether you're seeing 5 new patients or 34; you're just holding steady. Above it, momentum builds. Practices at 75-plus new patients a month grow at 9%, more than double the industry's weighted average.
It gets over looked because new patient acquisition looks like a marketing line item. It is something you optimize at the margin. The data reframes it as core growth infrastructure. If you're trying to move same-store growth, that's where it starts.
"New patient volume was the strongest predictor of growth by a wide margin. There's a clear threshold at about 35 new patients a month. Below it, you're just holding steady. Above it, momentum builds." Mehmet Dogan, VP of Marketing, Planet DDS
4. You identify a “danger zone” for DSOs in the 26–50 office range, where growth slows to a third of the rate of smaller or larger organizations. What's driving that, and what should a DSO leader in that range do about it?
This is the finding I'd point out the capital side of the room to. DSOs in the 26-to-50 office range grew at just 2.8% last year, less than a third of the rate of smaller groups. And only 55% of their offices were growing, the lowest percentage of any size tier we looked at. Meanwhile, groups in the 51-to-100 range bounce back to 7.4%, and 100-plus sit at 7.1%. So, it's not that scale hurts you. It's that there's a specific band where performance collapses.
What's happening structurally is an awkward adolescence. The entrepreneurial energy that drove the early growth has dissipated. The systems and processes that worked beautifully at 15 offices buckle under the weight of 40. But the organization isn't yet big enough to justify the enterprise infrastructure, the standardized platform, the centralized RCM, the operational playbooks that would carry it through.
My advice to a leader sitting at 20 or 30 offices: don't rush to 50 assuming growth will follow headcount. It won't. You face a real decision. Either stay lean and optimize what you have or commit to building the infrastructure to push through to enterprise scale. The worst outcome is getting stuck in the middle with neither.
5. The report also points to operational consistency — steady daily production — as a bigger growth lever than most leaders assume. What does that actually look like on the ground?
We measured it using the coefficient of variation, which quantifies how much a practice's daily production varies around its own average. And the spread was stark. The most consistent 10% of practices grew at 6.1%. The most volatile 10% actually shrank, at −3.4%. That's a 9.5 percentage point difference driven entirely by operational discipline, not by better markets or better patients. The consistent practices also produced 28% more per day, about $9,900 versus $7,200.
On the ground, consistency looks like owning your schedule. It's full, predictable days instead of packed Tuesdays and near-empty Fridays. And Friday is the clearest example across the industry, average Friday production runs about 27% below the Tuesday peak. But the roughly 9% of offices that actually peak on Friday grew at 8.1% versus 4.2% for everyone else. That's a four-point growth advantage from a single scheduling decision.
So when a leader asks where to focus, my answer is often unglamorous: before you chase a new growth initiative, stabilize your daily production. Fill the troughs. It compounds in a way that doesn't show up in any single quarter but absolutely shows up in the year-over-year numbers.
6. On the revenue cycle side, the data points to a $300–400 million addressable opportunity in uncollected revenue. What's the fastest, lowest-lift fix for a DSO leader who wants to close that gap?
Let me put the exact numbers on it, because they're bigger than most people expect. Across the DSOs we analyzed, total revenue leakage from gross production to cash was $1.328 billion, about 19.5% of gross. Now, part of that is structural: $532 million in contractual fee-schedule discounts and PPO adjustments that no amount of operational improvement will change. But the remaining $796 million is entirely addressable. It's money that was earned, billed, and lost to workflow gaps, not payer contracts. And when we model closing those gaps to realistic targets, the recoverable opportunity is roughly $621 million a year, without adding a single new patient, provider, or location.
That addressable gap breaks into three levers: bad debt recovery at $338 million, aged AR recovery at $208 million, and time-of-service collection at $76 million.
The fastest, lowest-lift fix is upstream of all three: it's eligibility. So much of the denial-and-rework cycle traces back to bad or missing eligibility data at the front desk. Manual verification takes 20 to 30 minutes per patient; staff are logging into five different portals, and when the data's wrong, the claim gets denied, the patient gets a surprise bill, and the whole thing gets reworked. That's exactly the problem we built AutoEligibility to solve, and it's why our partnership with DentalXChange matters here. AutoEligibility pulls real-time, standardized coverage details directly from the carrier: deductibles, waiting periods, frequency limits right into Denticon. It's not a yes/no check; it's the full picture, before the patient sits down. Practices are saving four to six hours a day per office, submitting cleaner claims, and giving patients estimates they can actually trust. It's closer to a configuration switch than a culture change, which is exactly what makes it the lowest-lift place to start.
"AutoEligibility pulls real-time, standardized coverage details directly from the carrier, deductibles, waiting periods, frequency limits, right into Denticon. It's not a yes/no check; it's the full picture, before the patient sits down. That's why our partnership with DentalXChange matters here." Mehmet Dogan,VP of Marketing, Planet DDS
7. If a DSO leader only has bandwidth to act on one insight from this report in the next 90 days, what would you tell them to prioritize?
It depends on which problem they have, and the report actually gives you a clean way to diagnose that. If your growth has stalled, the answer is almost always new patient volume. It's the strongest lever we found, and if you're under 35 a month per location, that's where the next 90 days should go.
But if I had to pick the single highest-confidence, fastest-payback move for most leaders, it's the revenue cycle. Here's why: every other lever in the report — new patients, consistency ,efficiency — requires you to change something operationally and then wait for it to compound. Fixing your revenue cycle doesn't. The patients are already in the chair, the production already happened, the money is already owed. You're just collecting what's yours. For a DSO doing $10 million in gross production, closing even half the average billing gap adds roughly $1.2 million in annual EBITDA without touching the top line. There's no other 90-day move in this report with that kind of return and that little execution risk.
8. How does Planet DDS's own platform data — Denticon, Cloud 9, Apteryx — factor into how you build these benchmarks, and why does that matter for how much readers should trust the numbers?
This is the whole reason the report exists in the form it does. Because all of this data comes from the same practice management platforms, the data definitions are consistent, the data dictionaries are normalized, and the workflows that put the data into the system are the same across every practice. We're not aggregating survey responses or stitching together exports from a dozen different systems and hoping the definitions line up. When we compare one practice's case completion rate to another's, we know they mean the same thing.
That's genuinely rare. Most industry benchmarks are built on surveys, which means self-reported numbers, small samples, inconsistent definitions, or collected from fragmented platforms through some kind of data analytics platform. Ours is the largest cloud dataset of DSO locations in the country — general dentistry through Denticon, orthodontics through Cloud 9, imaging through Apteryx — and it's real production data, de-identified and analyzed on a same-store basis. We serve 26 of the largest 50 DSOs in the country, and those were executive decisions to standardize on the platform, not accidents of acquisition. That's not a boast; it's the facts. And it's why our dataset carries weight. When most of your network is enterprise, your benchmarks reflect how enterprise actually operates.
The reason that matters for trust: when we say new patient volume is the strongest predictor of growth, or that 26-to-50 office DSOs grow at 2.8%, we're not asking readers to take our word for it. We're showing them what tens of thousands of practices actually did. Correlation still isn't causation — we're careful to say that — but these are observed patterns from real behavior, not opinions.
9. Is there anything you'd like to share about upcoming reports from Planet DDS?
We're continuing to invest in this. The direction we're most excited about is going from annual snapshots toward more current reads where the platform data updates in real time, so there's an opportunity to give the industry a fresher picture than a once-a-year report can. We're also building out more of the client-level and segment-level views that let a specific DSO see exactly where they sit against these benchmarks, rather than just the network averages.
I'd also point people to OrbitX and Dental Capital Forum, our executive gathering for DSO and OSO and PE leaders coming in spring 2027 — that's where a lot of these conversations go deeper with the people actually running these organizations. But I'd rather not over-promise specifics on the next report before it's finalized. What I can say is that the appetite for defensible, real-data benchmarking in this industry is only growing, and we intend to keep meeting it.
10. Where can our audience get the full report?
The full Deep Dive — all 46 pages, complete methodology and supporting data — is available on the Planet DDS website at PlanetDDS.com/outlookreport. And I want to stress: it's completely ungated. You don't have to trade an email address or fill out a form to get it. We publish the industry outlook and the Deep Dive because we think the data should be out there. Everything I've referenced here is in that report, sourced and explained.